Illustration (AI-generated): an unnamed American city from the air at dusk
Regional Futures SimulatorMajor US cities

For discussion, not a forecast

What could America's largest cities look like in 2040?

A small, documented model of people, homes, workers and jobs for major US cities, each modeled at its county, built from public data. Pick a city, move the levers and compare scenarios side by side.

Pick a city.

Each city is modeled at its county, the smallest area with complete public data on births, deaths, migration, permits, workers and jobs. New York City is its five boroughs combined. Every city uses the same engine, levers and tests, fitted to its own 2010–2025 history.

For discussion, not a forecast. These models show how a city's people, homes, workers and jobs fit together. A city is listed only if the model reproduces its 2010–2025 population within 2% on average and its labor force and jobs within 5%, and passes every extreme-condition test.

How each city maps to counties.

The model area is the county (or counties) that contain the city. Most counties include suburbs or unincorporated areas beyond the city limits, so the area modeled is usually larger than the city itself. Fit columns give the mean absolute percent error against recorded values, 2010–2025.

City-to-county mapping and fit

Swipe the table sideways to see every column.

What is in each model.

People

Eighteen five-year age groups, with births, deaths, people moving in and people moving out. Rates come from Census Bureau estimates and the American Community Survey.

Homes

Housing units built (from building permits) and lost. Empty homes draw movers in, which fills homes: the model's main balancing loop.

Workers and jobs

The working-age population sets the labor force through participation by age; jobs follow the labor force with a delay. Fitted to Bureau of Labor Statistics data.
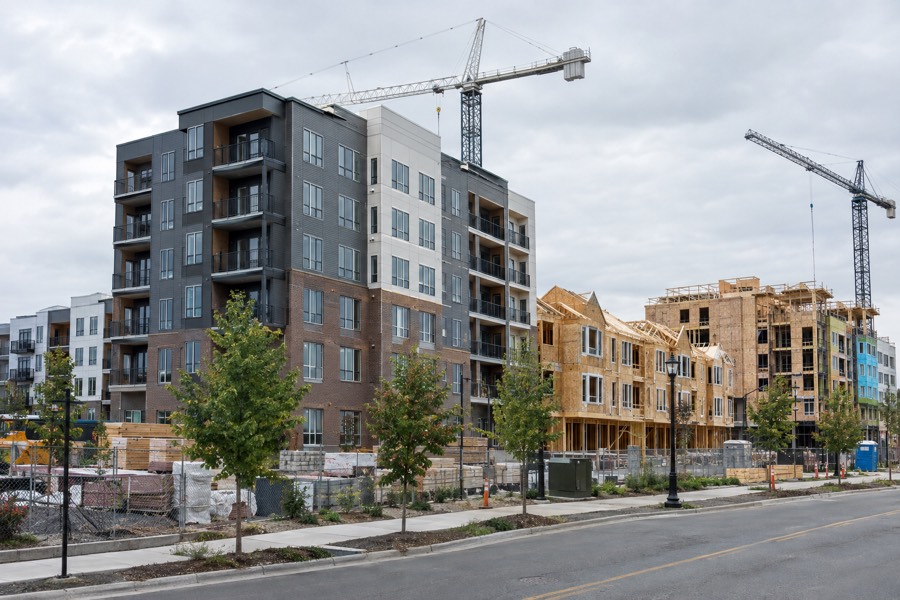
Three levers, four scenarios.

For discussion, not a forecast. It shows how a model of the area could work. Every equation, number and source is listed further down, and the effects that rest on judgment are marked "assumed".
Your scenario starts from

01,200

60%100%

0600

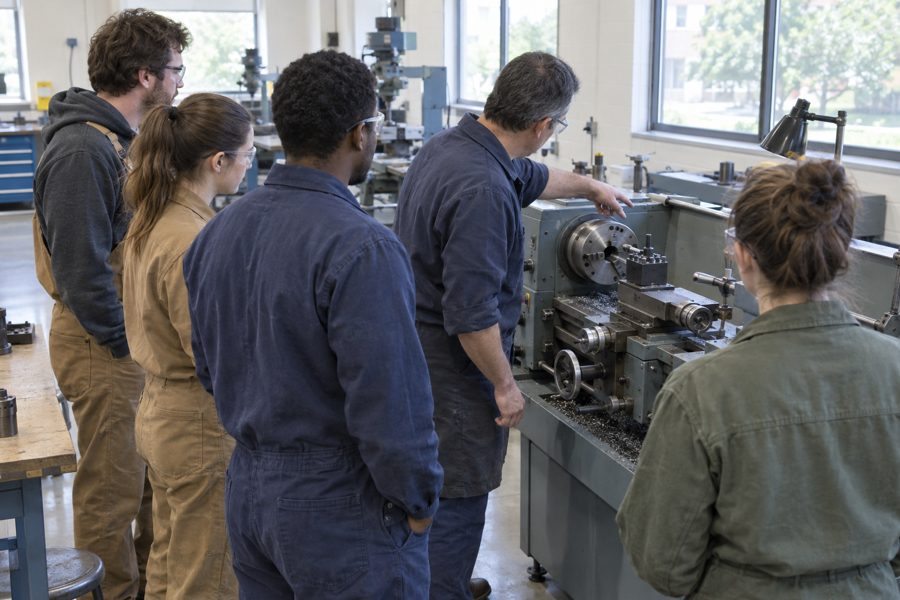
Slots beyond today's programs. A slot adds a worker only if the trainee completes, finds work and would not otherwise have been working (assumed shares, listed below).

Assumption, not a lever: how much does a shortage of homes hold back people moving in?

History from 2010 to 2025 cannot settle this. Each choice is a separate fit to the same history.

Side by side in July 2040

    Side-by-side comparison of scenarios in 2040

    Swipe the table sideways to see every scenario.

    How well the model reproduces 2010–2025.

    The model starts from the 2010 census and runs forward with only recorded home building as an outside input. Dots are recorded values; the line is the model.

    Fit statistics

    Fit statistics by series

    Swipe the table sideways to see every statistic.

    How this model works.

    A system dynamics model: stocks (people, homes, jobs) change only through flows (births, deaths, moves, building, loss), and a few feedback loops connect them. It steps forward a quarter of a year at a time from April 2010.

    Swipe the diagram sideways to see all of it.

    Area and public data used.